


Weight, blood pressure, cholesterol – doctors use these values to assess your overall health. Each one represents a key factor that over the years has been confirmed to be a key indicator of a person’s general state of health. Just as we have these data points to assess our health, key schedule metrics can aid in determining if a construction schedule is “healthy,” which is a strong indicator of project success. Just as a doctor does not rely solely on any one number in determining your health status, a schedule cannot be evaluated by any one metric. Here are some key components we would recommend you monitor to keep your schedule healthy and reliable:
The owner-contractor contract generally spells out the expectations regarding the project schedule. It ultimately dictates the requirements for the contractor’s schedule and is the measure by which the schedule will be judged for disposition. With that said, it is important that the contract include a specification that is tailored to the needs of the specific project. A “healthy” schedule is one that complies with contract terms that has mechanisms to create a tool that provides decision makers with the best information possible to make decisions.
Milestones, or key dates within the project, are a primary means of assessing project status. Tracking these interim key dates, and not just the project’s final completion date, provides a consistent benchmark to assess how the project is performing. As shown below, the forecasted date for schedule milestones can be tracked across multiple months to identify trends.
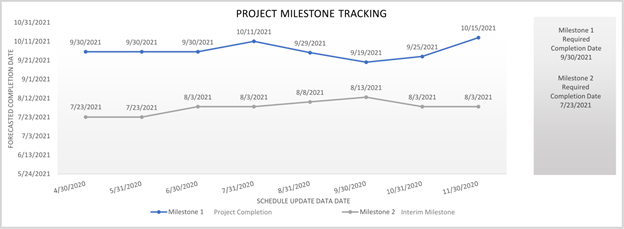
The forecasted milestones, in the above graphic, reflect significant variation with periods of schedule improvement, schedule delay, and stability. Each month, the schedule reviewer can determine the driving path to a milestone as well as what activities have contributed to the slip or improvement in the forecasted date for the milestone. This analysis can then inform corrective or mitigation actions and/or awareness of positive influencing factors on the forecasted dates.
With each new periodic schedule update, a contractor updates the progress completed since the last update. The contractor may also make changes to relationships or original durations within the schedule. These are generally referred to as “progress” and “revisions,” respectively.
In situations where the contractor makes both types of changes within one periodic update, it is helpful to distinguish between the effects of progress (or lack thereof) and the effects of revisions on the schedule. To do so, a reviewer can develop a “progress only” version of the schedule update. The “progress only” update is compared against the prior update to determine whether the contractor has kept pace with its plan. This analysis can provide insights into a specific update as well as trends over time.
The following chart summarizes days lost/gained due to progress as well as days lost/gained due to revisions within each schedule update. The black line presents the forecasted completion date of each schedule update.
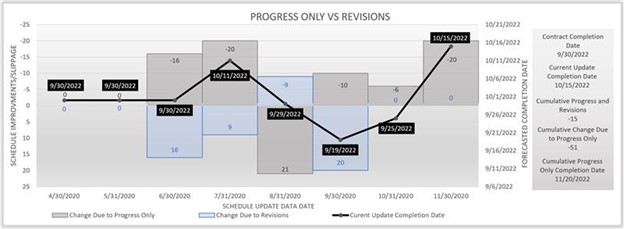
While the project’s completion date held steady for the first two months, the forecasted completion date experienced considerable variation thereafter due to the significant lack of progress (in all months except August) and then the subsequent revisions made to the schedule to regain lost time. Ultimately, in the last two months, no schedule revisions were made but the project failed to meet planned progress and the forecasted completion date continued to slip later. Lack of progress, month after month, whether recovered by revision or not, represents a warning sign of a potentially “unhealthy” schedule.
One of the most powerful ways to utilize a CPM schedule is to integrate the project costs with the schedule activities through the cost loading capabilities of the scheduling software. Cost loading allows the project costs (from the schedule of values, for example) to be assigned to specific schedule activities. In turn, the software can generate monthly and cumulative anticipated earnings curves, as shown below:
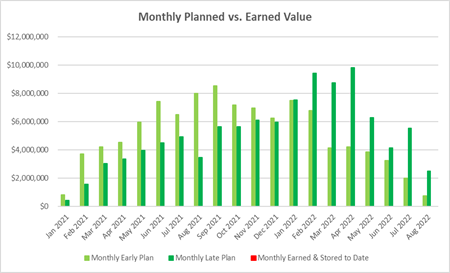
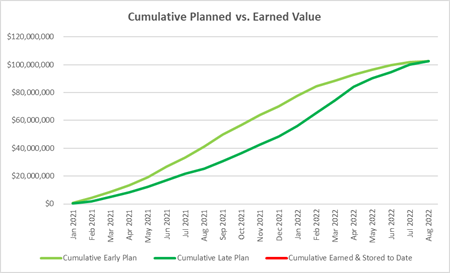
These curves represent a target range for evaluating project performance. As shown in the following figures, tracking actual earnings provides insight into the current status of the project, but also, the trend of actual earnings can forecast when the project may finish if the recent earnings rate continues.
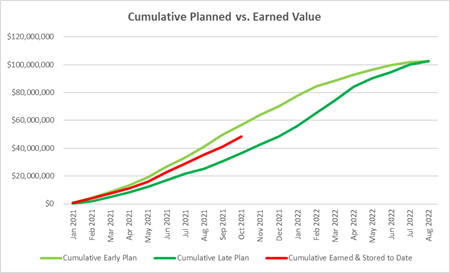
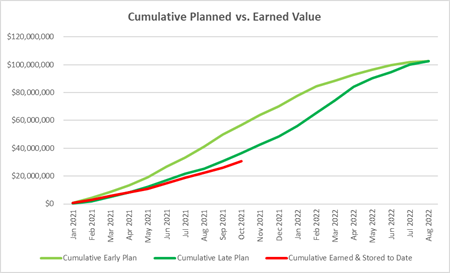
When actual performance curves drift below the projected late curves (as seen in the figure, “Behind Forecast”), there is a greater likelihood of late completion, i.e., evidence of an “unhealthy” schedule. Monitoring earned value and proactively detecting lagging performance provides project teams the opportunity to quickly examine root causes and develop schedule improvement strategies.
A construction schedule can provide untold metrics for evaluation. Just like a doctor evaluates numerous aspects of a person’s body to provide diagnoses and recommendations, a schedule reviewer must distill all the available data into actionable recommendations. To help achieve a healthy schedule for successful project delivery that is complete, accurate, realistic, and reliable, we recommend examining the following four key metrics:
Learn more about how MBP can provide insights to help you create a healthy schedule for a successful project.
Happy scheduling and stay healthy!
Comments